
Interpreting radar data#
Sparse IQ data#
Sparse IQ data is represented by complex numbers, one for each distance sampled. Each number has an amplitude and a phase, the amplitude is obtained by taking the absolute value of the complex number and the phase is obtained by taking the argument of the same complex number. A sweep is a array of these complex values corresponding to an amplitude and phase of the reflected pulses in the configured range.
For any given frame, we let \(z(s, d)\) be the complex IQ value (point) for a sweep \(s\) and a distance point \(d\).
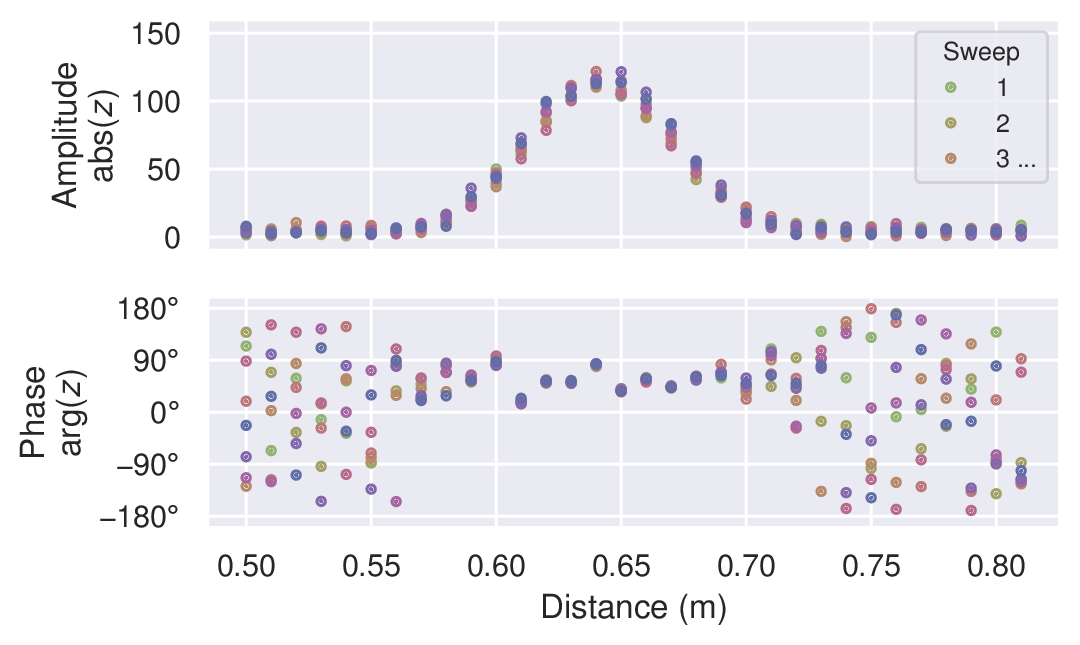
Figure 23 Mocked data of an environment with a single static object.#
In the simplest case, we have a static environment in the sensor range. Figure 23 shows an example of this with a single static object at roughly 0.64 m. The sweeps in the frame have similar amplitude and phase, and the variations are due to random errors. As such, they could be coherently averaged together to linearly increase signal-to-noise ratio (SNR). In this context, coherently simply means “in the complex plane”.
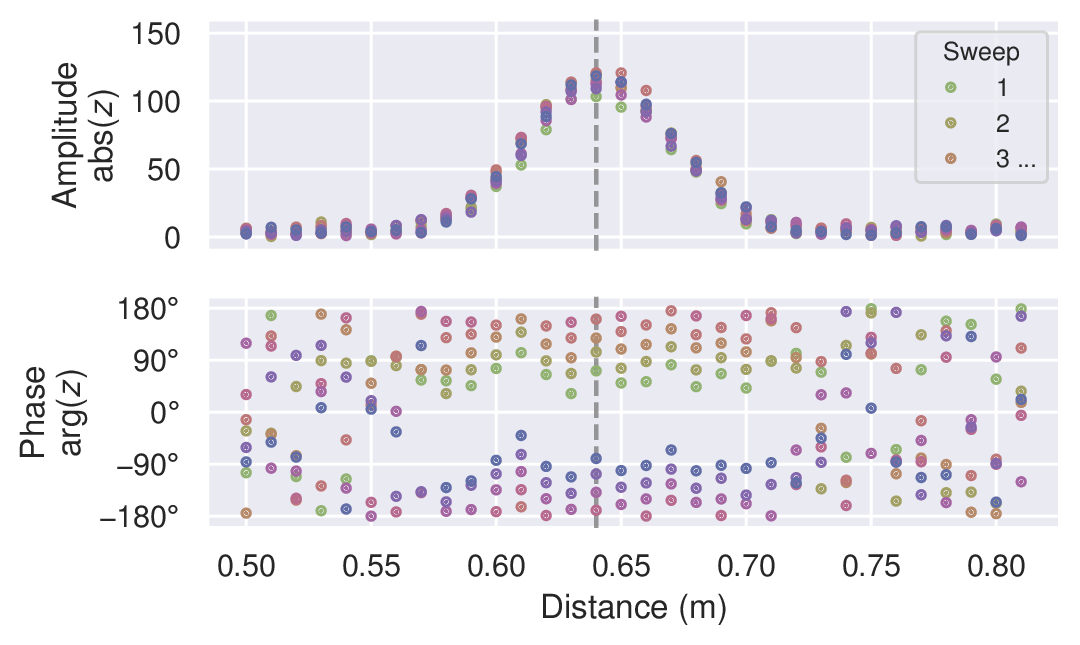
Figure 24 Mocked data of an environment with a single moving object.#
In many cases, we want to track and/or detect moving objects in the range. This is demonstrated in Figure 24, where the object has moved during the measurement of the frame. The sweeps still have roughly the same amplitude, but the phase is changing. Due to this, we can no longer coherently average the sweeps together. However, we can still (non-coherently) average the amplitudes.
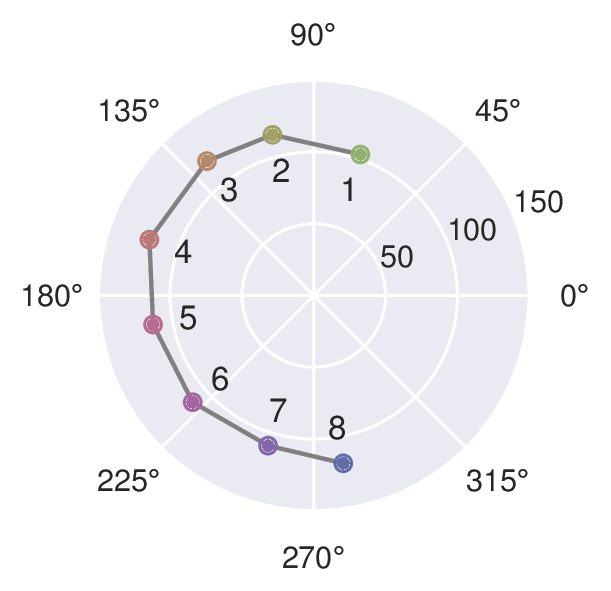
Figure 25 A slice of the mocked data in Figure 24 of an environment with a single moving object, shown in the complex plane.#
To track objects over long distances we may track the amplitude peak as it moves, but for accurately measuring finer motions we need to look at the phase. Figure 25 shows the slice of the data along the dashed vertical line in Figure 24. Over the 8 sweeps in the example frame, the phase changed ~ 210°. A full phase rotation of 360° translates to \(\lambda_\text{RF}/2 \approx 2.5 \text{mm}\), so the 210° corresponds to ~ 1.5 mm.
As evident from the example above, even the smallest movements change the phase and thus move the signal in the complex plane. This is utilized in for example the presence detector, which can detect the presence of humans and animals from their breathing motion. It can also be used to detect a change in signal very close to the sensor, creating a “touchless button”.
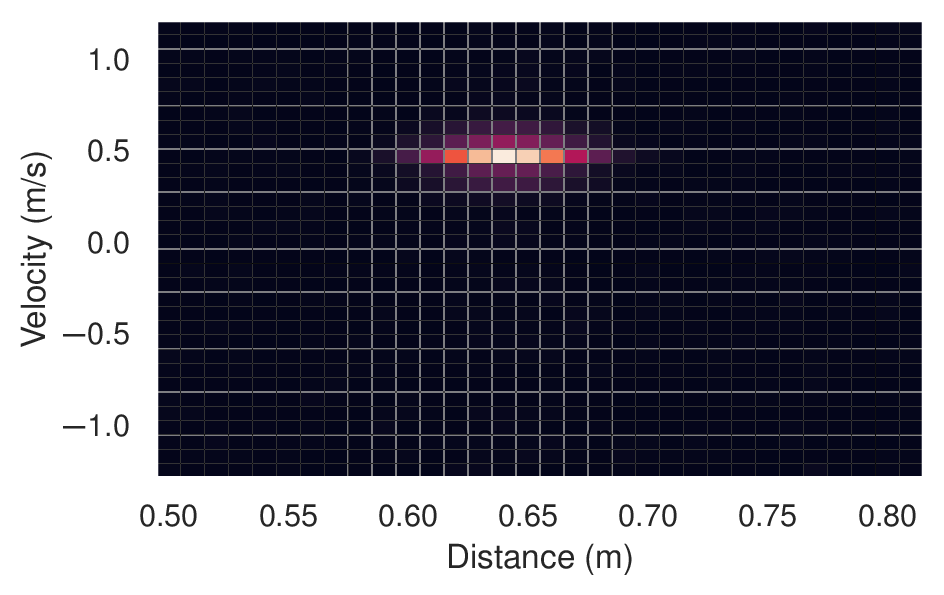
Figure 26 Mocked data of a single moving object, transformed into a distance-velocity (a.k.a. range-Doppler) map.#
As shown, the complex data can be used to track the relative movement of an object. By combining this information with the sweep rate, we can also determine its velocity. In practice, this is commonly done by applying the fast Fourier transform (FFT) to the frame over sweeps, giving a distance-velocity (a.k.a.range-Doppler) map. Figure 26 shows an example of this in which we can see an object at ~ 0.64 m with a radial velocity of ~ 0.5 m/s (moving away from the sensor). This method is commonly used for applications such as micro and macro gesture recognition, velocity measurements, and object tracking.
Multi-channel IQ data#
For A212, each frame carries IQ data from multiple virtual channels (TX-RX antenna pairs). The data model from the section above extends to a third index \(c\) for the channel:
where \(s\) is the sweep index, \(d\) the distance point index, and \(c\) the virtual channel index (TX-major order, see Frames, sweeps and subsweeps).
Across any single channel, the same concepts apply as described above: coherent averaging over sweeps improves SNR for static objects, and changes in phase over sweeps indicate motion.
Having IQ data from multiple TX-RX pairs enables spatial processing. Each TX transmits from a distinct position and each RX receives from a distinct position. A signal from a target at angle \(\theta\) therefore arrives at each channel with a characteristic phase offset determined by the antenna positions and the carrier wavelength. These phase offsets can be utilized by beamforming, which forms a weighted sum of the channels to filter returns by direction. The result is a spatial map of received power versus angle and distance, commonly referred to as a heatmap, as illustrated in Figure 27.
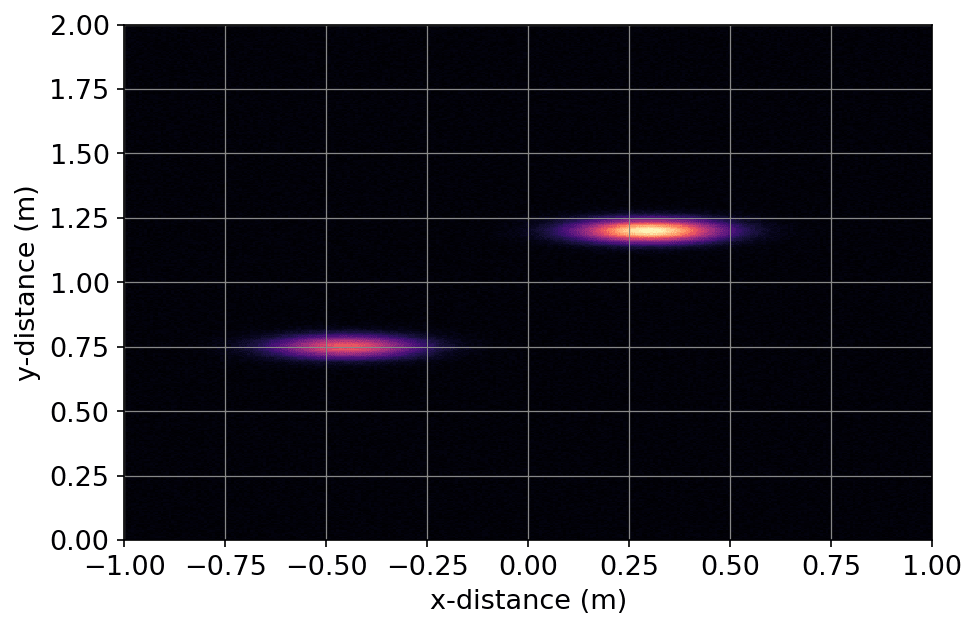
Figure 27 Mocked beamformed output of an environment with two objects at different positions. The x-axis is the cross-range dimension and the y-axis is the range dimension. Bright regions indicate high reflected signal amplitude.#