Vibration Measurement#
This example application illustrates how the A121 sensor can be used to estimate the frequency content of a vibrating object, measured at a distance.
The Sparse IQ service produces complex data samples where the amplitude reflects the amount of returning energy and the phase the relative timing between the transmitted and received pulse. The phase can be used to detect small displacements. The vibration measurement application takes advantage of this, by forming a time series of the measured phase at a single distance point, which is then analyzed using an FFT. See Interpreting radar data for more information about the produced data.
Usage#
This section describes how to get started with the Vibration Example Application, how to configure it and important concepts.
Your first measurement#
To make a first measurement, it is recommended to connect one of Acconeer’s evaluation kits to the Exploration Tool.
Choose Vibration Measurement in the GUI.
Place the sensor facing the object in the vibrating direction.
Set the distance from the sensor to the object by adjusting the parameter
measured_point and then press start measurement.
Exploration Tool#
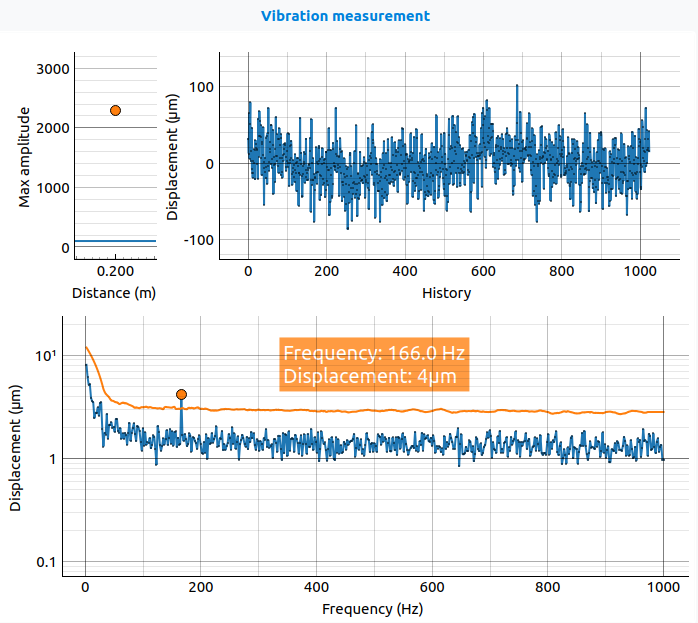
The GUI, see figure below, has three plots. The upper left plot indicates the amplitude at the measured point. The purpose of this is to provide visual feedback on whether or not the object is located at the right distance from the sensor. The blue horizontal line shows the chosen amplitude threshold. With no object in front of the sensor, the value should be close to zero. When moving an object into the correct location, the value increases. Next, the upper right plot shows the displacement of the measured object. Here, the phase has been converted to \(\mu m\), indicating the physical displacement of the object. Lastly, the lower plot shows the calculated spectrum. In this case, the vibrating object has a dominant frequency at 166 Hz. The orange line shows the CFAR threshold, and the orange dot shows the peak value. Note that the upper right plot and bottom plot only are updated when the object’s amplitude is above the amplitude threshold.

Embedded C#
An embedded C application is provided in the Acconeer SDK, available at the Acconeer Developer Site.
The embedded application has the same presets as Exploration Tool and has most of the output Exploration Tool has. Max amplitude (upper left plot), peak displacement and frequency of the spectrum (peak in lower plot) are available in the result struct.
By default, the application prints the result using printf which usually is connected to stdout or a debug UART, depending on environment. The application is provided in source code.
Presets#
In the Vibration Example App there are two presets that can help as a starting point depending on the desired frequency span that is of interest:
- High frequency
This preset will detect vibrations with frequencies up to 5000 Hz. The measurement distance is 0.2 m.
- Low frequency
For this preset, low frequency enhancement is enabled, see Low Frequency Enhancement. Vibrations with frequencies up to 100 Hz will be detected at a distance of 0.2 m.
Time Series#
If continuous sweep mode is enabled, set by continuous_sweep_mode,
the length of the time series is determined by the parameter
time_series_length.
A longer time series will give more points in the resulting spectrum. The frequency resolution
is given by the ratio of the sweep rate and the number of points in the time series.
If continuous sweep mode is not enabled, the time between two consecutive sweeps and two consecutive frames will not be the same.
Due to this, the FFT will be calculated on a per frame basis, meaning that the time series length will be equal to the number of sweeps per frame,
sweeps_per_frame,
and time_series_length parameter
will be redundant.
The sweep rate, sweep_rate,
should be set high enough to be able to capture the highest frequency of interest.
The Nyquist theorem states that the sampling rate must be at least twice the highest frequency that is of interest.
The example app configuration also has a time constant,
lp_coeff,
applied together with an exponential filter, providing the possibility to time filter the
calculated spectrum. A higher time constant gives a more stable spectrum.
However, the spectrum will also adapt slower to changes in the frequency content.
For every frequency in the spectrum, the power is converted to a displacement.
The displacements can be computed in two different ways, either as amplitude or peak to peak value.
This is set by the reported_displacement_mode
parameter.
Thresholds#
There are two threshold parameters,
amplitude_threshold,
and threshold_margin, which are used together.
The first one determines if an object is in front of the sensor and if the
algorithm should run, while the second one is used to find peaks in the frequency spectrum.
The algorithm only calculates the FFT if there is an object in front of the sensor and
the amplitude threshold,
amplitude_threshold,
sets the needed amplitude for an object to be considered detected.
When an object is detected, the FFT is calculated and a CFAR threshold is computed to determine peaks in the spectrum,
and the overall sensitivity of the CFAR threshold is adjusted by the threshold margin,
threshold_margin.
Low Frequency Enhancement#
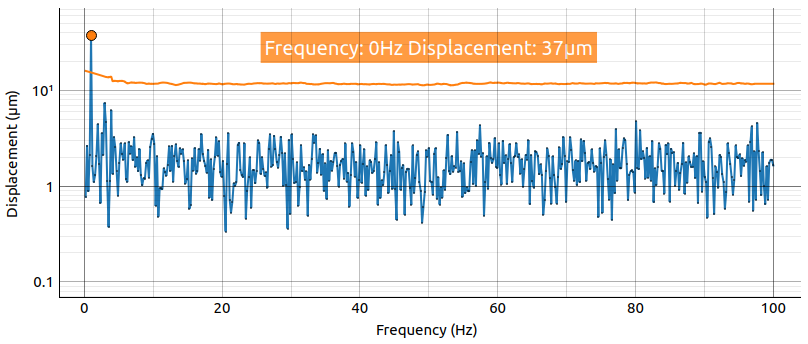
Low frequencies, down to about 1 Hz, can sometimes be difficult to detect in the spectrum due to an increased noise floor.
To correct the noise floor, a subsweep with a loopback measurement (see Configurations for more information) can be added.
The loopback measurement is used to adjust the phase for each sweep to compensate for jitter in the measurement.
This will create a flat noise floor in the FFT, see figure below.
This feature can be enabled with the parameter
low_frequency_enhancement.
Since a subsweep is added, the number of samples is increased and thus, the sweep rate cannot be as high as without this feature.
Due to this, it is only recommended to enable this feature if there is an interest in detecting very low frequencies.

Example App Output#
The ExampleAppResult class contains all output result from this example application.
For the decision if an object is present in front of the sensor or not, the maximal amplitude is used, and this is reported in the
max_sweep_amplitude.
As well as reporting the largest detected displacement,
max_displacement,
and for which frequency this is found,
max_displacement_freq,
all displacement together with all the frequencies they are calculated for is reported in the
lp_displacements
and the
lp_displacements_freqs.
However, usually it is the maximal displacement and the corresponding frequency that is of highest interest.
The last reported result is the
time_series_std,
which is the standard deviation of the last processed time series.
Exploration Tool Python API#
Configuration Parameters#
- class acconeer.exptool.a121.algo.vibration._example_app.ExampleAppConfig(*, measured_point: int = 80, time_series_length: int = 1024, lp_coeff: float = 0.95, threshold_margin: float = 10.0, amplitude_threshold: float = 100.0, reported_displacement_mode=ReportedDisplacement.AMPLITUDE, low_frequency_enhancement: bool = False, profile=Profile.PROFILE_3, frame_rate: float | None = None, sweep_rate: float = 3000, sweeps_per_frame: int = 128, hwaas: int = 16, double_buffering: bool = True, continuous_sweep_mode: bool = True, inter_frame_idle_state: IdleState = IdleState.READY, inter_sweep_idle_state: IdleState = IdleState.READY)#
- measured_point: int#
Measured point.
- time_series_length: int#
Length of time series. This value will be overridden by the number of sweeps per frame if continuous sweep mode is not enabled.
- lp_coeff: float#
Specify filter coefficient of the exponential filter for the FFT. A higher value means more filtering, i.e., slower response to changes.
- threshold_margin: float#
Specify threshold margin (micrometer).
- amplitude_threshold: float#
Specify minimum amplitude for calculating vibration.
- reported_displacement_mode: ReportedDisplacement#
Selects whether to report the amplitude or peak to peak of the estimated frequency.
- low_frequency_enhancement: bool#
Adds a loopback subsweep for phase correction to enhance low frequency detection.
- frame_rate: float | None#
Frame rate in Hz.
- sweep_rate: float#
Sweep rate in Hz.
- sweeps_per_frame: int#
Number of sweeps per frame.
- hwaas: int#
Number of HWAAS.
- double_buffering: bool#
Enables double buffering.
- continuous_sweep_mode: bool#
Enables continuous sweep mode.
Example App Result#
- class acconeer.exptool.a121.algo.vibration._example_app.ExampleAppResult(*, max_sweep_amplitude: float, lp_displacements: ndarray[tuple[Any, ...], dtype[float64]] | None = None, lp_displacements_freqs: ndarray[tuple[Any, ...], dtype[float64]], max_displacement: float | None = None, max_displacement_freq: float | None = None, time_series_std: float | None = None, processor_extra_result: ProcessorExtraResult, service_result: Result)#
- max_sweep_amplitude: float#
Max amplitude in sweep.
Used to determine whether an object is in front of the sensor.
- lp_displacements: ndarray[tuple[Any, ...], dtype[float64]] | None#
Array of estimated displacement (μm) per frequency.
- lp_displacements_freqs: ndarray[tuple[Any, ...], dtype[float64]]#
Array of frequencies where displacement is estimated (Hz).
- max_displacement: float | None#
Largest detected displacement (μm).
- max_displacement_freq: float | None#
Frequency of largest detected displacement (Hz).
- time_series_std: float | None#
Time series standard deviation.
- processor_extra_result: ProcessorExtraResult#
Processor extra result, used for plotting only.